by Frank Wessels | August 1, 2023
Sneller plugin for Grafana
We are pleased to announce the availability of the Sneller plugin for Grafana!
Using this plugin you can do the following:
- create graphs on data coming from a Sneller database.
- create alerts that are triggered when certain conditions are met.
You can find the plugin on the Grafana website under the Sneller Grafana Data Source link.
GitHub archive
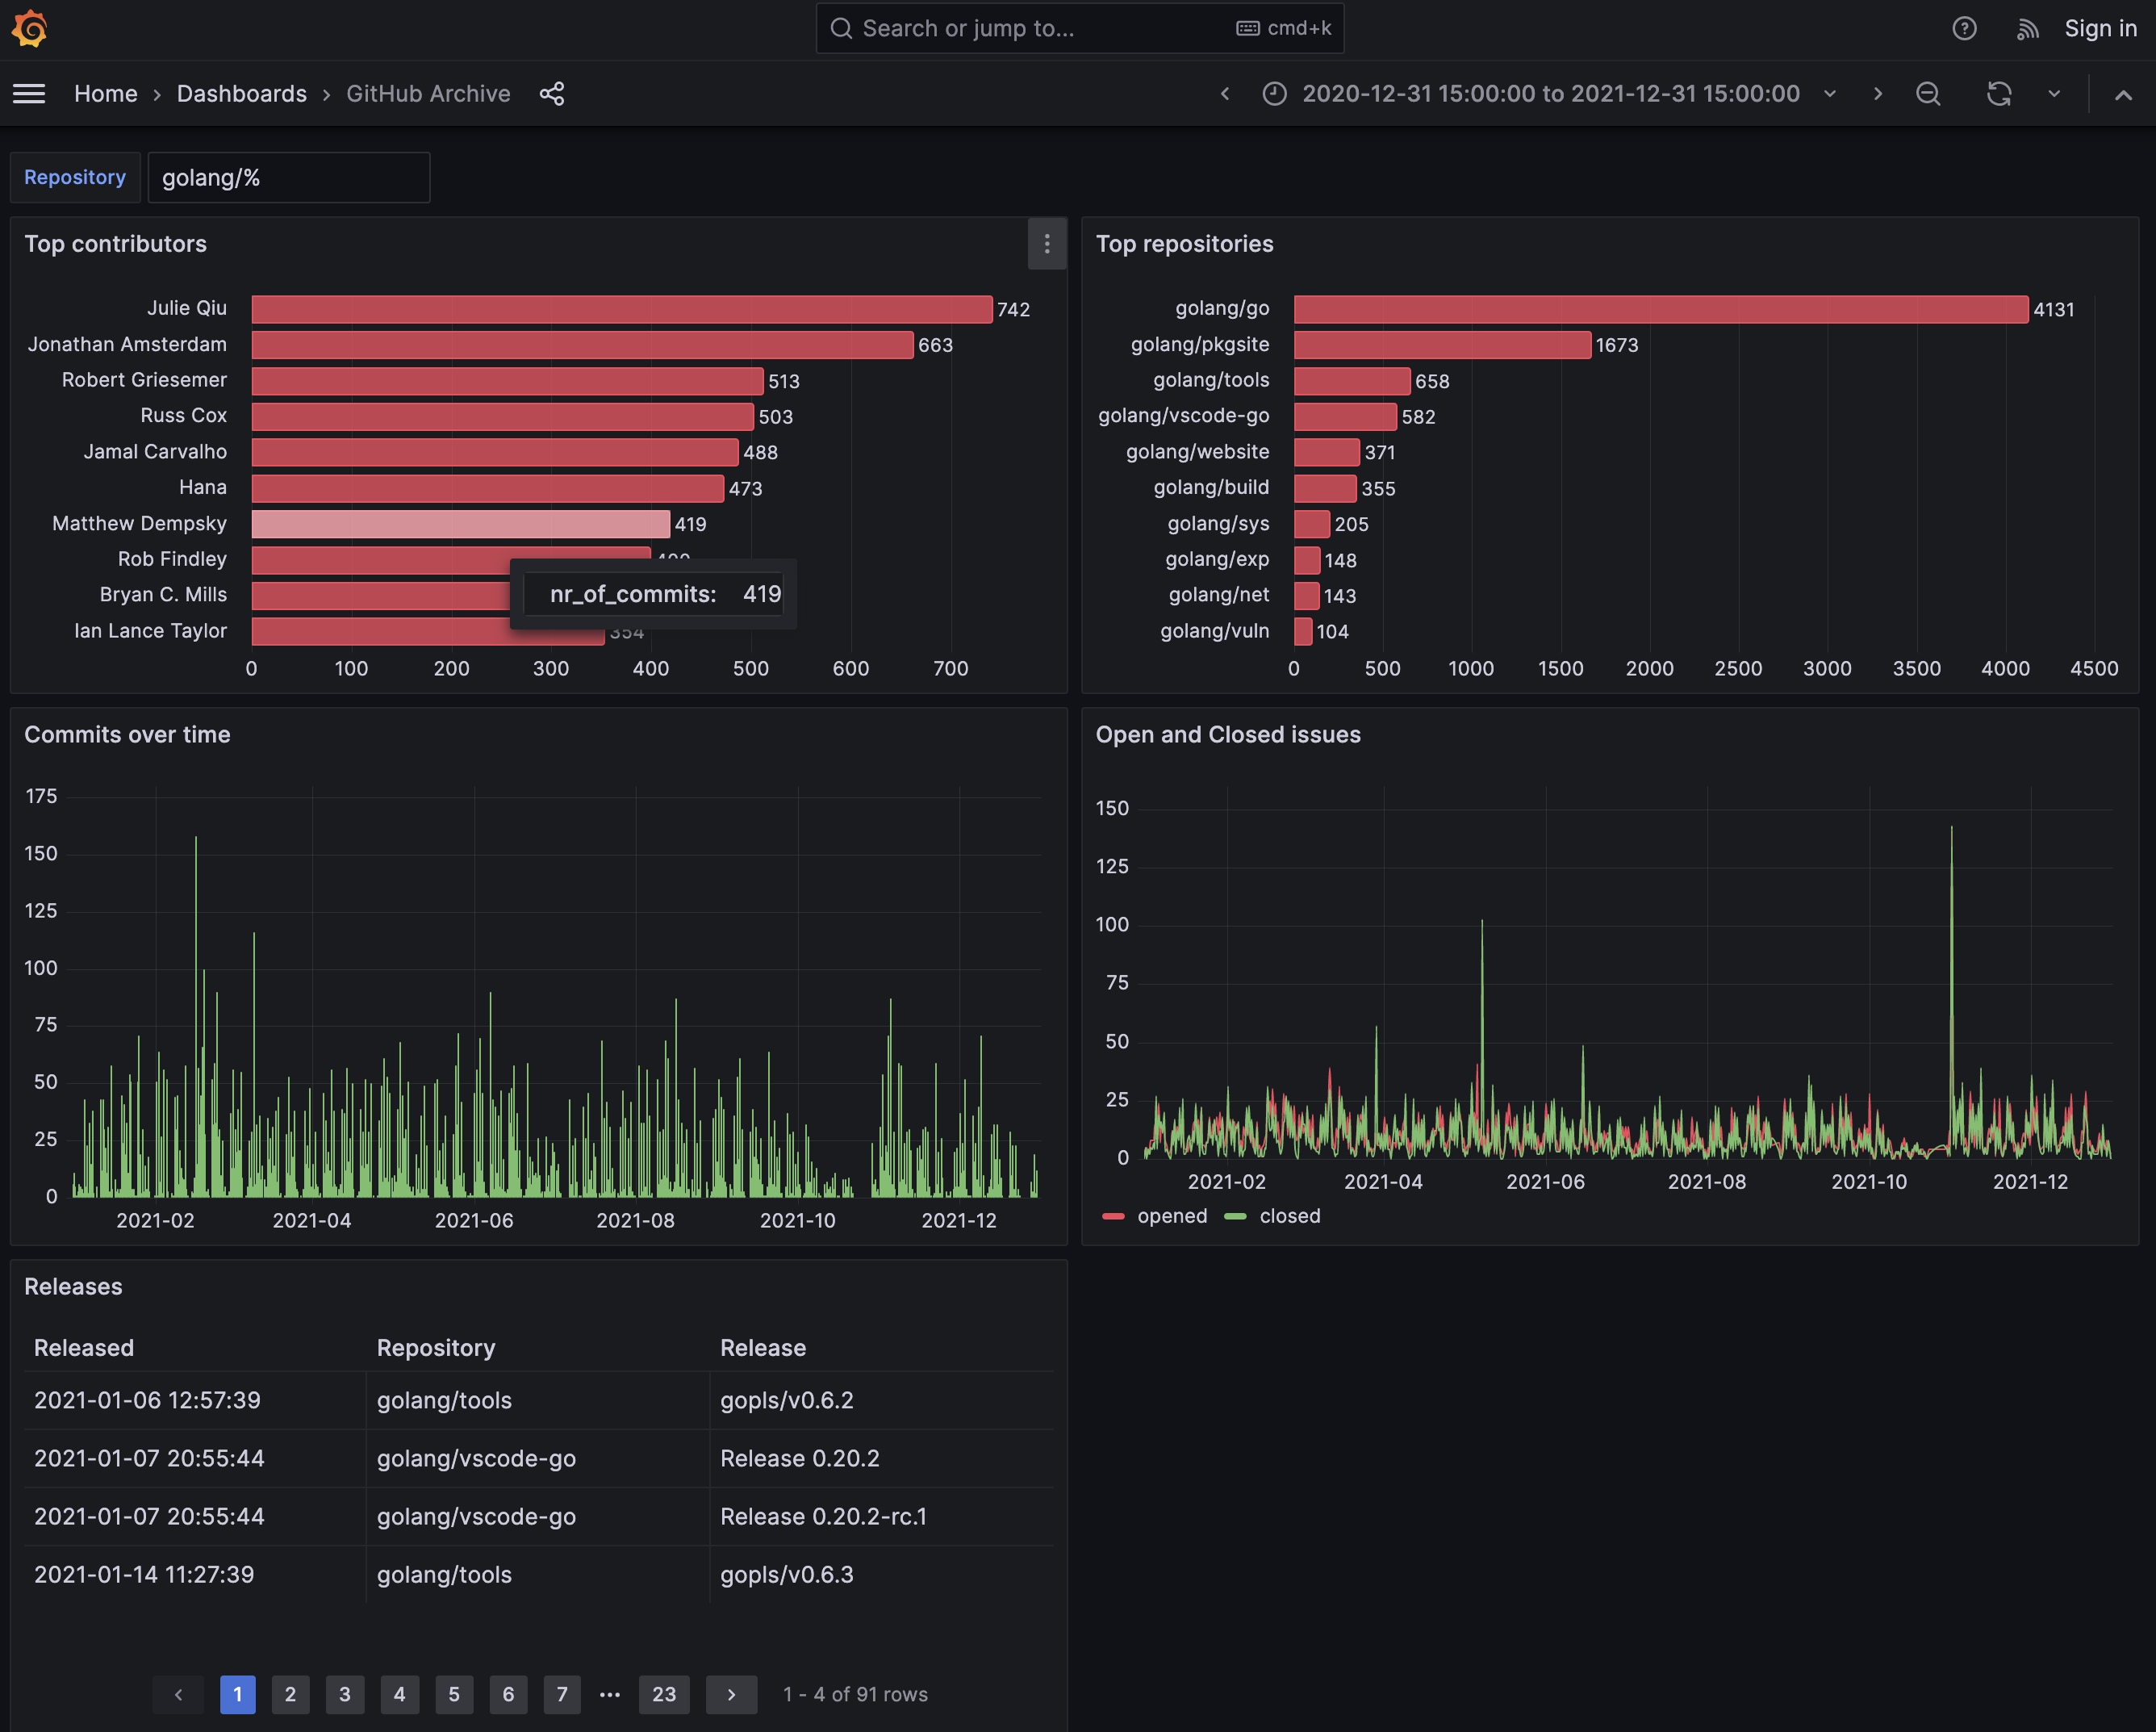
In our playground we have 1 billion records from the GitHub archive for the year 2021 available (which totals over 5 TB of JSON data). So this is a great data source on which to run a dashboard.
You can see the dashboard live at this link: https://play-grafana.sneller.io/d/gha/github-archive
To interact with it, try out this:
- change the repository on which to filter
- for instance: try minio, grafana – or your own repository or handle !
- zoom in on a particular data range
- pin to a particular repo (hover over top right chart)
Of course this is just a “sample” dashboard that shows some of the capabilities that Grafana in combination with Sneller has to offer.
Setting up the Grafana plugin
If you want to setup the Sneller plugin yourself, follow these steps below.
Installation
Please follow the official documentation on how to install a public data source from the Grafana store: https://grafana.com/docs/grafana/latest/administration/data-source-management/#add-a-data-source
Search for “Sneller” to find the official Sneller data source.
Configuration
The Sneller data source only requires a small handful of settings to get started.
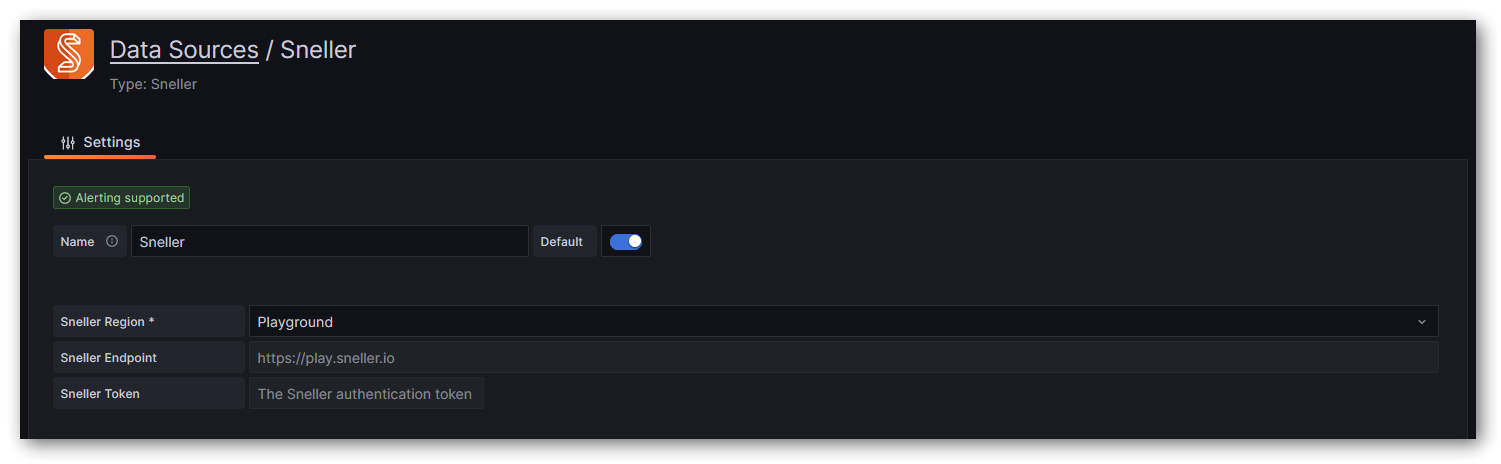
Sneller Region
If you are using Sneller Cloud, you can select your bucket region (e.g. us-east-1) from the drop-down menu to automatically configure the endpoint URL.
If you are using a self-hosted Sneller instance, please select custom and make sure to enter your endpoint URL as well.
If you are not yet using Sneller for your production data, but would like to experiment with (as in the sample dashboard above) the GitHub archive data for 2021, select playground. In this case, no endpoint and token need to be configured.
Sneller Endpoint
This value is automatically set for Sneller Cloud instances after you select your bucket region in the Sneller Region drop-down menu.
For self-hosted Sneller instances, this value must be set to your snellerd endpoint URL.
Sneller Token
Please insert the Sneller access token that will be used to retrieve data. This can either be the token you received during the initial setup of the tenant or a custom access token.
You do not need to specify a token for the playground region.
Creating a dashboard
In this example we do operate on the playground data in the gha table of the demo database.
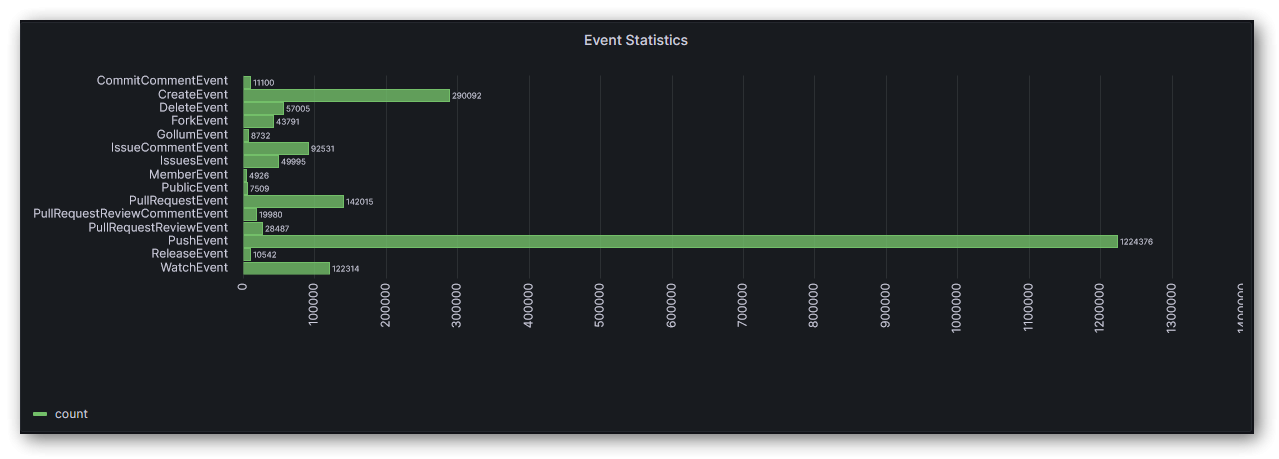
After creating a dashboard, we add our first panel and paste the following query text in the query editor:
SELECT COUNT(*),
       type
FROM gha
WHERE $__timeFilter(created_at)
GROUP BY type
ORDER BY type
Voila! After setting the date-range to something like 2021-01-30 22:00:00 to 2021-01-31 22:00:00 (just an example range for which the GitHub Archive 2021 contains records), we can see the following graph:
Macros and Variables
Grafana has support for various macros and variables (such as $__from and $__to for date ranges, $__interval_ms for automatic scaling of date histograms, etc.). See the Sneller plugin documentation for more info.
Deep dive
If you want to get more in-depth information on the Grafana plugin, be sure to checkout the using Grafana with Sneller section in the docs.
Happy dashboarding !
Try Sneller for Free
You can try Sneller right now on your own data for free through our playground.
If you’re a developer interested in the details of how Sneller works under the hood, you’re in luck: Sneller is open source software!