by Phil Hofer | June 19, 2023
One of the first things you’ve got to think about after you have built an MVP for your cloud software is how you’re going to monitor the software once you’ve deployed it. Specifically, you’ve got to think about collecting logs, metrics, and other kinds of telemetry from your software (and likely also from the hardware, VM, or container in which it is running) in order to help determine if things are running smoothly.
Since Sneller Cloud runs on EC2 inside AWS, we collect the following:
- AWS CloudTrail Logs (to capture all of our AWS API calls)
- AWS VPC Flow Logs (to capture all of our network traffic flows)
- Service logs (logs from our software plus all the other systems services running in our VM, like
sshd,dhcpcd,chronyd, and so forth) - System metrics (loadavg, memory usage, etc.)
For our “service logs,” we use a small Go daemon that periodically scrapes
log files on each host, converts them to JSON, adds some additional tags
(like the EC2 instance ID, AWS region, VM name, and so forth) and then
uploads those (zstd-compressed) JSON logs to an S3 bucket.
If you’re interested in doing something like this yourself and don’t want to
write any new code, you should consider Vector or fluentd.
If you’re running Go binaries and you’re using the slog package,
then you can simply configure your programs to output JSON directly, which simplifies things considerably.
Since Sneller Cloud makes it super easy for us to query all of those data sources using ordinary SQL, that’s exactly what we do! Sneller’s automatic sparse time index picks up the timestamps in all of the data sources listed above in order to make aggregations and point-searches within specific time windows super quick.
(You can read more about how to set up CloudTrail and VPC Flow tables in Sneller here.)
Dashboards
We use Grafana for our dashboards with the Sneller Plugin. These two solutions together make it quick and easy for us to turn SQL queries into charts:
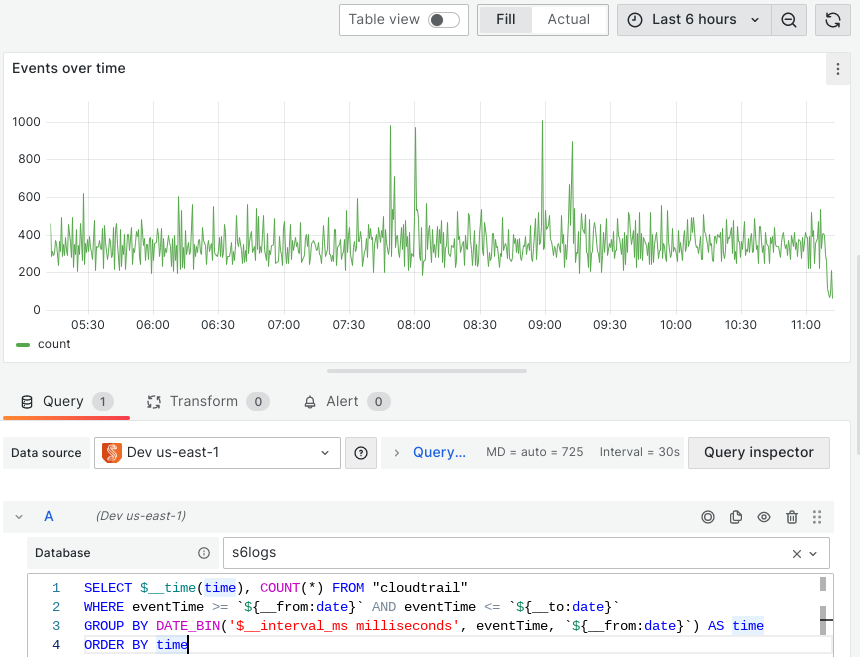
Notice how we can inject the width of the time series panel (with ${__from:date} and ${__to:date})
as well as the width of each timestamp bucket (the “interval”, identified as 30 seconds) as $__interval_ms.
Incorporating those bounds into the query ensures that we only scan data in our logs that is directly relevant
to rendering the chart. When you select a different time range in your dashboard (either via the drop-down menu
or by selecting a range in a chart with your cursor) the queries sent to Sneller Cloud will change to reflect
the new time window as a consequence of Grafana expanding these macros differently.
(You can read more about these special variables here. You can also define your own variables in your dashboards that are adjusted with drop-down menus.)
Alerts
We use Grafana Alerting for our alerts, since we’re already using Grafana for our dashboards.
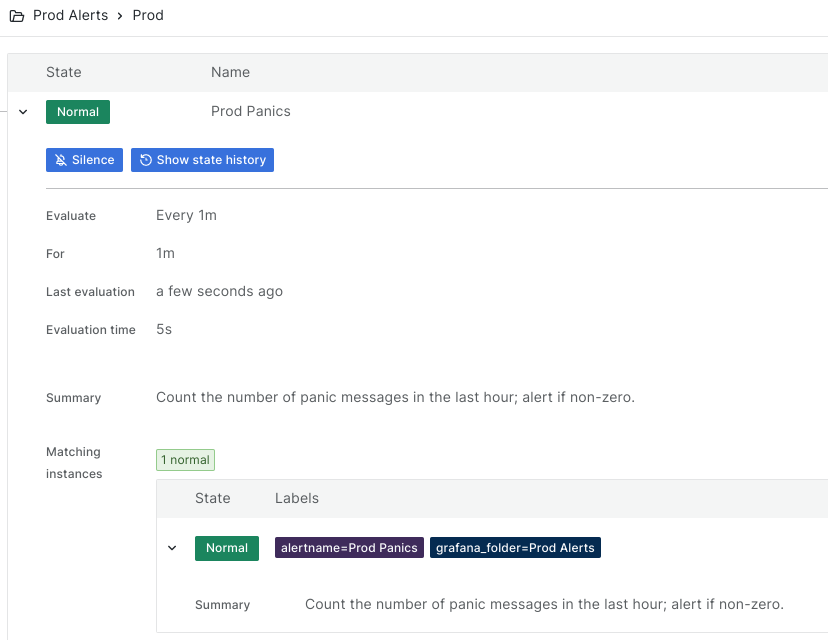
Typically, our alerts look for specific patterns (e.g. WHERE message_body LIKE 'panic:%')
and fire when the number of matching log lines for these patterns in a given time window is non-zero.
Try Sneller for Free
You can try Sneller right now on your own data for free through our playground.
If you’re a developer interested in the details of how Sneller works under the hood, you’re in luck: Sneller is open source software!